Team Turnaround Case Study

This case study presents a real project. All distinguishing names have been disguised, but the data has not been altered.

Case Study Context

  • This team of 64 had been hand-selected six months earlier to commercialize a game-changing technical breakthrough for the 7,000-person organization.
  • Despite the people and resources devoted to this project, progress was far slower than expected, and the team had missed important deadlines.
  • The original project manager abruptly resigned, and a new leader, Anya, accepted the position, with a mandate to make a quick transition and get the team back on track.
  • Anya struggled to identify why the team was floundering, so she decided that an organizational network analysis (ONA) would clarify the best path forward.

Executive Summary

With the ONA survey results in, Anya began her review with the summary analytics.

Three important insights were evident to Anya immediately.


Although the team was well connected overall (each person had ~13 relationships on average), very few connections were with people from other functions.

% Connectivity Across Functions

The team indicated that instead of operating as a cohesive team, sub-groups had formed, each focused on their own goals.

Dominant Network Archetype

After such an enthusiastic project launch, the low energizing and open indicator was a sure signal that commitment, engagement, and high-quality interactions were lacking.

% Energizing and Open Interactions

Detailed Results

After reviewing the executive dashboard, Anya dove deeper into the platform analytics to better understand the team dynamics and develop a plan to mobilize the group once again.

Full Group Network
New York & London Networks

Networks Diagrams Highlighted the Functional Silos

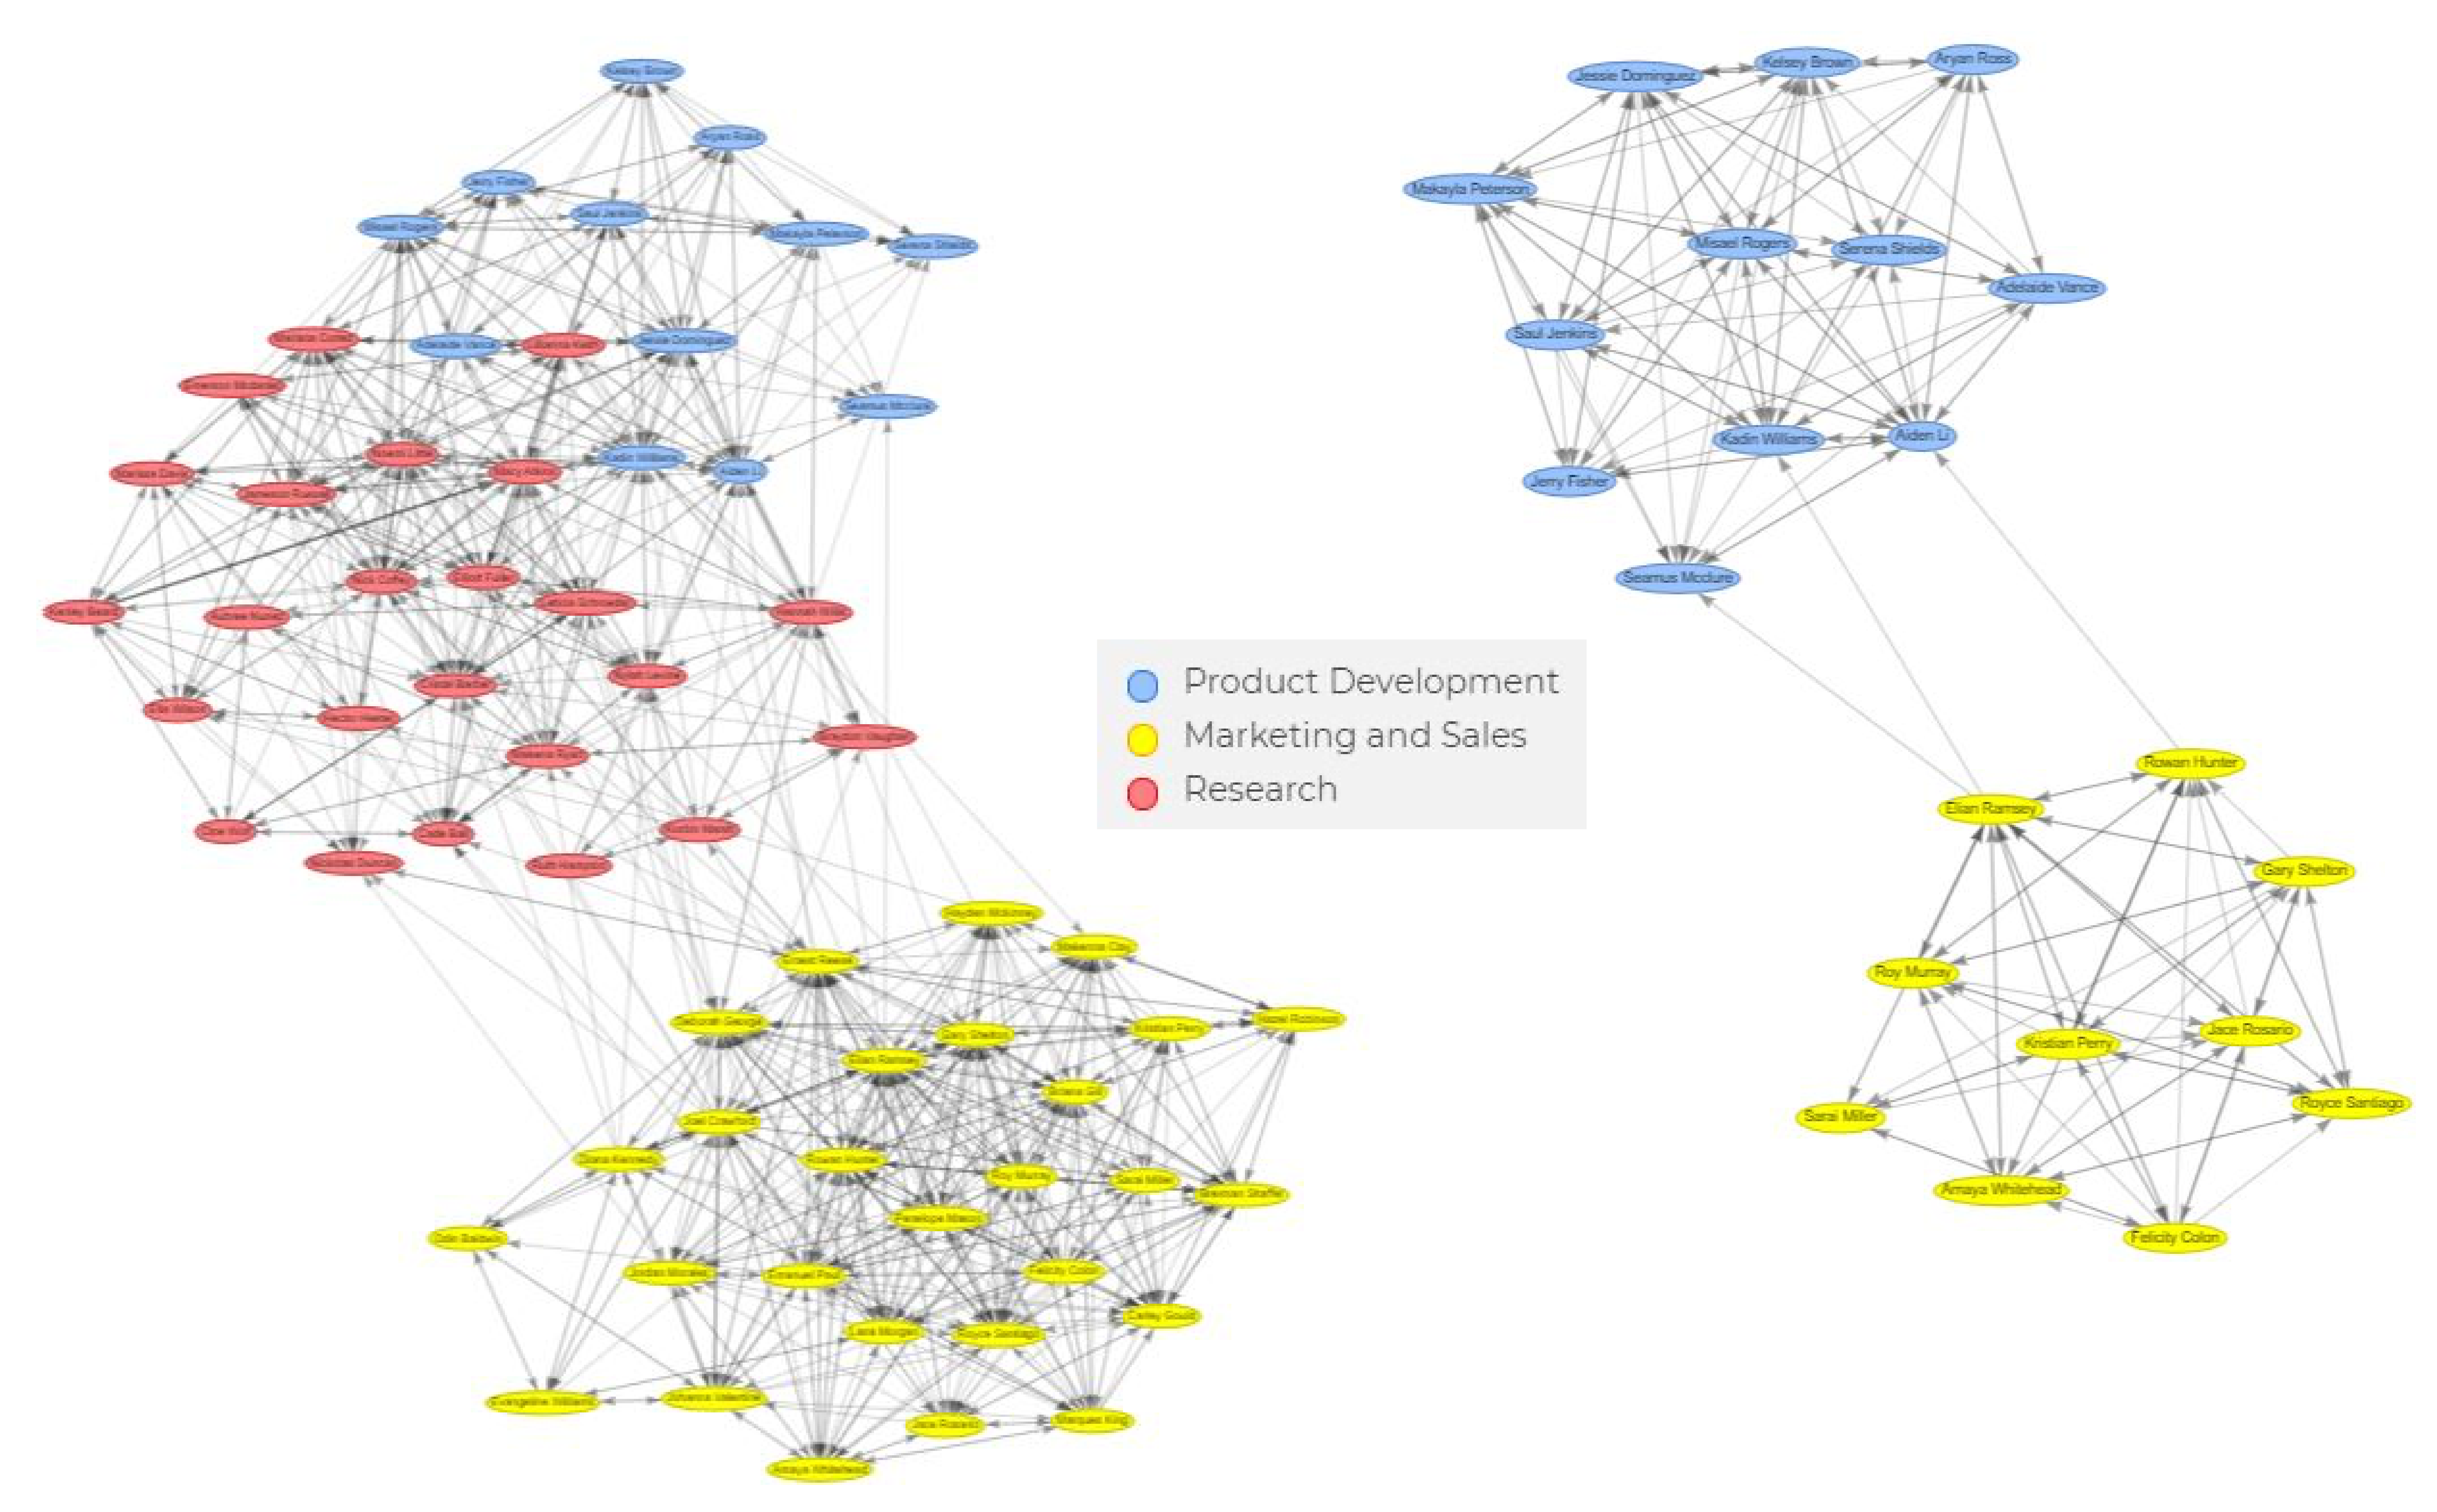
Through this visualization, Anya could clearly see the silo that had developed between Marketing and Sales, and Research and Product Development.

When narrowing in on two sub-teams in London and NYC that were supposed to be iterating on one aspect of the new product, the silo became more obvious.

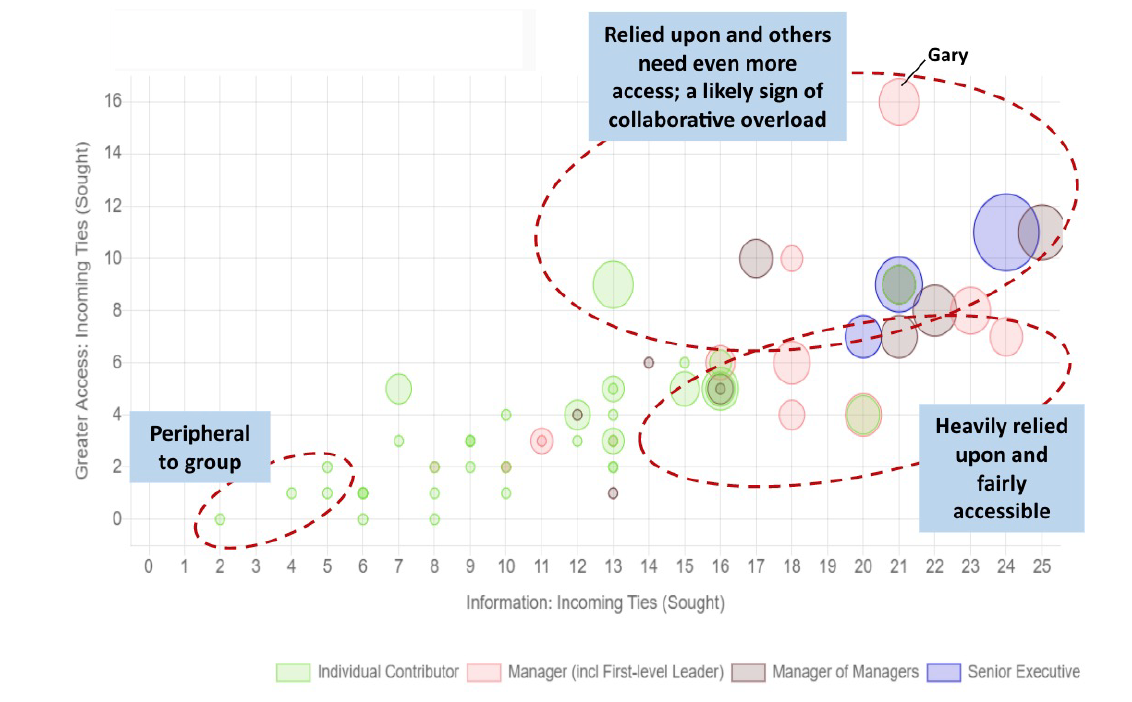
Note: Each node represents a person and the lines represent relationships between people.

Heat Maps Quantified Collaboration Within & Across Sub-teams

Anya wanted to share these evidence-based findings with the group without revealing names, and this heat map, which quantified collaboration, provided just that.

She could clearly share where the collaboration was breaking down, and explain the steps that were beginning to form in her mind to overcome these rifts.

Note: Heat maps depict the expected level of collaboration, based on group size and the overall number of connections.

Influencer Analysis Informed Leader Selection

As Anya began to think about who to select to lead each sub-group, the influencer analysis provided key information. It allowed her to see who:

  • Others sought out, signaling that a relationship already existed (on the x-axis).
  • Was not already overloaded with other responsibilities (on the y-axis).
  • Others saw as a source of energy and enthusiasm, which would contribute to positive and engaging interactions (bubble size).

Sortable Scorecard Provided Additional Views

The CEO told Anya that Gary Shelton would be a good selection to lead the Marketing & Sales team. However, his high overload index (red bars) indicated that he was drowning. In fact, it turned out that he was burned out and looking for a new job. Makenna has also been nominated, but her low energy levels were sure to present a challenge.

Instead, Anya went through the scorecard to identify people who were rising stars – those who were well connected (but not necessarily top connectors), highly energizing, and had relationships into other sub-teams.

Comparison of Critical Collaborative Practices

Armed with the knowledge of team agreement across key practices, Anya was able to pull out next steps from the research-based recommendations in the platform.

She was happy to see that 63% of the team felt that the key collaborators were acknowledged, but could see that there was much work to improve connections external to each function, as well as in other areas.

Individual Reports

After the ONA results were shared with the team, Anya distributed personalized reports to all team members to help them to understand and adapt their own networks.

3 pages of the 11 page report are shown below

Personal Network Reports

Knowing that the individual reports would provide her team members with valuable insights into their own networks, Anya sent them out after the overall findings and initial actions were shared.

A partial view of Brennan’s report is shown here (3 of the 11 pages). Brennan was seen as an energizer, with a higher than average 56%, but his network was highly concentrated within his function, Marketing & Sales—one thing he planned to change!

Note: For confidentiality, the report removes all names other than that of the person receiving the report.